Inscrivez-vous maintenant pour un meilleur devis personnalisé!


The ELK stack is a setofanalytics tools. Its initials represent Elasticsearch,LogstashandKibana. Elasticsearch is a flexibleandpowerful open source,distributed,real-time searchandanalytics engine. Logstash is a tool for receiving,processingandoutputting logs,like system logs,webserver logs,error logs, application logsandmany more. Kibana is an open source (Apache-licensed), browser-based analyticsandsearch dashboard for Elasticsearch.
ELK is a very open source, usefulandefficient analytics platform, and we wanted to use it to consume flow analytics from a network. The reason we chose to go with ELK is that it can efficiently handle lotsofdata and it is open source and highly customizable for the user's needs. The flows were exported by various hardware and virtual infrastructure devices in NetFlow v5 format. Then Logstash was responsible for processing and storing them in Elasticsearch. Kibana, in turn, was responsible for reporting on the data. Given that there were no complete guides on how to use NetFlow with ELK,below we present a step-by-step guide on how to set up ELK from scratch and enabled it to consume and display NetFlow v5 information.Readers should note that ELK includes more tools, like Shield and Marvel, that are used for security and Elasticsearch monitoring, but their use falls outside the scope of this guide.
In our setup, we used
For our example purposes, we only deployed one node responsible for collecting and indexing data. We did not use multiple nodes in our Elasticsearch cluster. We used a single-node cluster. Experienced users could leverage Kibana to consume data from multiple Elasticsearch nodes. Elasticsearch, Logstash and Kibana were all running in our Ubuntu 14.04 server with IP address 10.0.1.33. For more information on clusters, nodes and shard refer to the Elasticsearch guide.
Elasticsearch requires a recent version of Java. That can be installed using
sudo apt-get install openjdk-7-jre
To download and run Elasticsearch, use the following:
curl -O https://download.elasticsearch.org/elasticsearch/elasticsearch/elasticsearch-1.1.1.tar.gz tar zxvf elasticsearch-1.1.1.tar.gz cd elasticsearch-1.3.4/ ./bin/elasticsearchElasticsearch can also be started in the background using the-doption
./bin/elasticsearch -dAlternatively, someone that wanted torun Elasticsearch as a servicecould download the .deb file from the Elasticsearch download page and install it using
dpkg -i elasticsearch.debTo stoporstart the Logstash service, use
dpkg -i elasticsearch.deb sudo serviceelasticsearch restart / stop / status
1. To run Logstash, just download the latest version tar.gz and extract the archive.
curl -O https://download.elasticsearch.org/logstash/logstash/logstash-1.4.2.tar.gz zxvf logstash-1.4.2.tar.gz cd logstash-1.4.2Then you can test that it works by manual sending logs to Logstash
bin/logstash -e 'input { stdin { } } output { stdout {} }'and type
hello worldLogstash should print the log:
2014-11-01T01:22:14.405+0000 0.0.0.0 hello worldTo test Logstash with Elasticsearch, tell Logstash to take the logs from standard input (console) and output them to Elasticsearch that is in the same server as Logstash using the following command:
bin/logstash -e 'input { stdin { } } output { elasticsearch { host => localhost } }'and type some text that will be the log that will be stored in Elasticsearch. Then check the Elasticsearch logs by going toh++p://10.0.1.33:9200/_search?pretty
More information can be found in the Logstash 1.4.2 tutorial.
Alternatively, someone that wanted torun Logstash as a servicecould download the .deb file from the Elasticsearch download page and install it using
dpkg -i logstash.debTo stop or start the Logstash service, use
dpkg -i logstash.deb sudo service logstash restart / stop / status
2. Logstash configuration
Logstash can use static configuration files. Logstash comes with a NetFlow codec that can be used asinput or outputin Logstash as explained in the Logstash documentation. Below we will create a file namedlogstash-staticfile-netflow.confin the logstashdirectory.The filewill tell Logstash to use the udp plugin and listen on UDP port 9995 for NetFlow v5 records as defined in Logstash's NetFlow codec yaml file. Logstash can consume NetFlow v5 and v9 by default, but we chose to only list for v5 here.
input { udp {port => 9995 codec => netflow{ definitions => "/home/administrator/logstash-1.4.2/lib/logstash/codecs/netflow/netflow.yaml" versions => [5] } } } output { stdout { codec => rubydebug }if ( [host] =~ "10\.1\.1[12]\.1" ){ elasticsearch { index => "logstash_netflow5-%{+YYYY.MM.dd}" host => "localhost" } } else { elasticsearch { index => "logstash-%{+YYYY.MM.dd}" host => "localhost" } } }Note that in the configuration file above, if the source of the NetFlow is one of 10.1.11.1 or 10.1.12.1, the data is exported to Elasticsearch in an index namedlogstash_netflow5-YYYY.MM.ddwhereYYYY.MM.ddis the date the data was received. The rest of the collected data that come from different sources will be stored in indices namedlogstash-YYYY.MM.dd. That way we use different indices for NetFlow from our sources of interest. As we will see later, the index will be use in Kibana to only view logs of interest. Separate daily indices also make it easier to purge data.
The Logstash configuration file can then be tested for errors and used in Logstash to listen for NetFlow and export it to Elasticsearch.
bin/logstash --configtest -f logstash-live-netflow.conf bin/logstash -f logstash-live-netflow.confIf Logstash is installed as a service, the configuration file needs to be copied to the/etc/logstash/conf.ddirectoryand theservice restarted:
cp logstash-live-netflow.conf /etc/logstash/conf.d/logstash/logstash-live-netflow.conf sudo service logstash restartMore information about static Logstash configuration files is in the Logstash 1.4.2 tutorial.
Logstash can also be run using theweboption that enables both the agent and the Logstash web interface in the same process. Then it can be accessed using h++p://10.0.1.33:9292. We will not be using the Logstash web interface in our deployment.
After running Logstash with the NetFlow config file, if Logstash sees NetFlow records on UDP port 9995 it will store the data in the indices defined in the configuration file. To view statistics about the indices and an index namedlogstash_netflow5-2014.11.10in Elasticsearch,you can use
curl 'localhost:9200/_cat/indices?v' curl 'localhost:9200/logstash_netflow5-2014.11.10/_stats'To delete an index in Elasticsearch namedlogstash_netflow5-2014.11.10 you can use
curl -XDELETE 'http://localhost:9200/logstash_netflow5-2014.11.10'
3. Elasticsearch index templates
The indices we created before contain information imported from NetFlow. To be able to parse the fields from NetFlow using types that we want, we will use index templates by using the following in the Elasticsearch node:
curl -XPUT localhost:9200/_template/logstash_netflow5 -d '{ "template" : "logstash_netflow5-*", "settings": { "index.refresh_interval": "5s" }, "mappings" : { "_default_" : { "_all" : {"enabled" : false}, "properties" : { "@version": { "index": "analyzed", "type": "integer" }, "@timestamp": { "index": "analyzed", "type": "date" }, "netflow": { "dynamic": true, "type": "object", "properties": { "version": { "index": "analyzed", "type": "integer" }, "flow_seq_num": { "index": "not_analyzed", "type": "long" }, "engine_type": { "index": "not_analyzed", "type": "integer" }, "engine_id": { "index": "not_analyzed", "type": "integer" }, "sampling_algorithm": { "index": "not_analyzed", "type": "integer" }, "sampling_interval": { "index": "not_analyzed", "type": "integer" }, "flow_records": { "index": "not_analyzed", "type": "integer" }, "ipv4_src_addr": { "index": "analyzed", "type": "ip" }, "ipv4_dst_addr": { "index": "analyzed", "type": "ip" }, "ipv4_next_hop": { "index": "analyzed", "type": "ip" }, "input_snmp": { "index": "not_analyzed", "type": "long" }, "output_snmp": { "index": "not_analyzed", "type": "long" }, "in_pkts": { "index": "analyzed", "type": "long" }, "in_bytes": { "index": "analyzed", "type": "long" }, "first_switched": { "index": "not_analyzed", "type": "date" }, "last_switched": { "index": "not_analyzed", "type": "date" }, "l4_src_port": { "index": "analyzed", "type": "long" }, "l4_dst_port": { "index": "analyzed", "type": "long" }, "tcp_flags": { "index": "analyzed", "type": "integer" }, "protocol": { "index": "analyzed", "type": "integer" }, "src_tos": { "index": "analyzed", "type": "integer" }, "src_as": { "index": "analyzed", "type": "integer" }, "dst_as": { "index": "analyzed", "type": "integer" }, "src_mask": { "index": "analyzed", "type": "integer" }, "dst_mask": { "index": "analyzed", "type": "integer" } } } } } } }'The above template tells Elasticsearch that for all indices that start withlogstash_netflow5-, every 5s, it should parse the fields according to the types defined in the template and only include the fields of interest to be collected for analysis. For example, thein_bytes and in_pktsare imported as strings by default, and we convert them to long integers that will help us with the Kibana graphs. Also theipv4_src_addr and ipv4_dst_addrare converted totype: "ip"in Elasticsearch, which is a numeric value that allows easy sorts and range queries (using ip values). Of course, we could keep the default"string"type.
If someone wanted to create a template that includes more fields, for example for NetFlow v9, one could easily put them in the template. To be able to view the fields from a NetFlow record, visit h++p://10.0.1.33:9200/_search?pretty to view the fields of the records and then add them to the template.
To view the Elasticsearch templates, you can use
curl -XGET localhost:9200/_template?pretty curl -XGET localhost:9200/_template/logstash_netflow5?prettyTo delete a template named logstash_netflow5, you can use
curl -XDELETE localhost:9200/_template/logstash_netflow5More information about Elasticsearch index templates is in the Elasticsearch documentation.
1. Download and run Kibana as explained in the Kibana installation instructions:
wget https://download.elasticsearch.org/kibana/kibana/kibana-3.1.1.tar.gz tar xvf kibana-3.1.1.tar.gz
2. Kibana configuration
Change the Kibana config file
sudo vi ~/kibana-3.1.1/config.jsby putting in it
elasticsearch: "http://"10.0.1.33",
3. Move Kibana files to the appropriate location in the Ubuntu server web directory
sudo mkdir -p /var/www/kibana3 sudo cp -R ~/kibana-3.1.1/* /var/www/kibana3/Readers should note that every time there are updates in thekibana-3.1.1directory, files would need to be recopied after cleaning up the directory:
sudo rm -rf /var/www/kibana3/* sudo cp -R ~/kibana-3.1.1/* /var/www/kibana3
4. Install and configure Nginx
Nginx is an open source web server that we use to proxy for Elasticsearch. First let's install it:
sudo apt-get install nginxThe file /etc/nginx/sites-available/defaulttells Nginx to proxy request on port 80 to Elasticsearch running on port 9200:
vi /etc/nginx/sites-available/defaultThe file content can be something like
#If you use this, you'll want to point config.js at#http://FQDN:80/ instead of http://FQDN:9200#upstream elasticsearch { server 127.0.0.1:9200; keepalive 15; }server { listen *:80 ;server_name 10.0.1.33;access_log /var/log/nginx/kibana.myhost.org.access.log; location / {root /var/www/kibana3;index index.html index.htm;proxy_http_version 1.1; proxy_set_header Connection "Keep-Alive"; proxy_set_header Proxy-Connection "Keep-Alive";} location ~ ^/_aliases${ proxy_pass http://127.0.0.1:9200; proxy_read_timeout 90; } location ~ ^/.*/_aliases${ proxy_pass http://127.0.0.1:9200; proxy_read_timeout 90; } location ~ ^/_nodes${ proxy_pass http://127.0.0.1:9200; proxy_read_timeout 90; } location ~ ^/.*/_search${ proxy_pass http://127.0.0.1:9200; proxy_read_timeout 90; } location ~ ^/.*/_mapping { proxy_pass http://127.0.0.1:9200; proxy_read_timeout 90; }#Password protected endpoints location ~ ^/kibana-int/dashboard/.*${ proxy_pass http://127.0.0.1:9200; proxy_read_timeout 90; limit_except GET { proxy_pass http://127.0.0.1:9200; auth_basic "Restricted"; auth_basic_user_file /etc/nginx/conf.d/kibana.myhost.org.htpasswd; } } location ~ ^/kibana-int/temp.*${ proxy_pass http://127.0.0.1:9200; proxy_read_timeout 90; limit_except GET { proxy_pass http://127.0.0.1:9200; auth_basic "Restricted"; auth_basic_user_file /etc/nginx/conf.d/kibana.myhost.org.htpasswd; } } }In the file, for performance reasons, we made sure there is a persistent connection between Nginx and Elasticsearch using keepalives (upstream and proxy_setdirectives). The password-protected endpoints ensure that users cannot create and save dashboards without being able to authenticate according to the credentials in the/etc/nginx/conf.d/kibana.myhost.org.htpasswd directory. kibana-intis the default Elasticsearch index to use for storing Kibana-specific objects such as stored dashboards as defined in the Kibana configuration file at~/kibana-3.1.1/config.js. For more information on Elasticsearch and Nginx, refer to the more tricks with Nginx guide.
If you want to restrict users from seeing certain data, theoretically using index aliases with Nginx could work, but according to Elasticsearch documentation, that will not work easily due to the way Nginx interprets variables in regular expressions. Thus, someone would need to use complicated rewrites (explained here) or use a different proxy, not Nginx.
Also make sure that the Kibana configuration file~/kibana-3.1.1/config.jthat you edited earlier still points to Elasticsearch on port 80, which Nginx will proxy and not the default 9200.
elasticsearch: "http://10.0.1.33",Then let's create the file with the credentials for user authentication in Kibana's defaultkibana-int indexmentioned above. Usehtppasswd of apache2-utils(after installing it) to configure a username usernameX and a password that will be able to make changes to Kibana like creating and saving dashboards:
sudo apt-get install apache2-utils sudo cp nginx.conf /etc/nginx/sites-available/default sudo htpasswd -c /etc/nginx/conf.d/kibana.myhost.org.htpasswd usernameX < ...password creating and confirmation... >
5. Restart Nginx after making all the changes:
sudo service nginx restart
6. Kibana web interface
For our exercise we wanted to use Kibana to view top destinations and ports with most traffic, the protocols that use the most traffic and a traffic graph. Of course, there are many more graphs that could be produced in Kibana.
Before using the Kibana web interface, make sure Elasticsearch is running and potentially that Logstash is also running and importing data in Elasticsearch as shown in the steps above. Note that the collected data might take a few minutes to show in Kibana.
Visit h++p://10.0.1.33. Kibana comes with some preinstalled dashboards to use with Logstash, for example, h++p://10.0.1.33/index.html#/dashboard/file/logstash.json. Of course, administrators can edit and create new dashboards. Dynamic scripted dashboards (.js) are also possible. Here we will only show a couple of panels we used to demonstrate the NetFlow data collected.
To be able to only see specific NetFlow data stored in the Elasticsearch index we created later, start from the h++p://10.0.1.33/index.html#/dashboard/file/logstash.json dashboard and change the dashboard setting by clicking theConfigure Dashboardicon at the top right and set the Index tab to have anIndex Pattern of [logstash_netflow5-]YYYY.MM.DDand Timestamp value ofday.
To filter the data shown in Kibana's dashboards, we can use filters or queries. For example, to only view information about FTP's control channel (TCP port 21) we can use a querystring ofnetflow.l4_dst_port:21. Similarly, we can use a filter or query withnetflow.protocol:17to only process UDP flow information. Finally, a filter withField: netflow.ipv4_dst_addr and Value: 10.0.1.21will filter on flows that were only destined to 10.0.1.21.
For more information on filters and queries, refer to the queries and filters documentation.
Now we can see the top destinations and top destination ports based on the bytes sent. We create atablepanel with theInspect checkboxchecked, withTerm Mode: terms_ stats, Stats type: total, Field: netflow.ipv4_dst_addr and Value Field: netflow.in_bytes. The Style ispie. Similarly, we can do the same for destination ports. We create anablepanel with theInspect checkboxchecked, withTerm Mode: terms_ stats, Stats type: total, Field: netflow.ipv4_dst_port and Value Field: netflow.in_bytes. The Style ispie. These two pie charts show which destinations and ports have seen the most data:
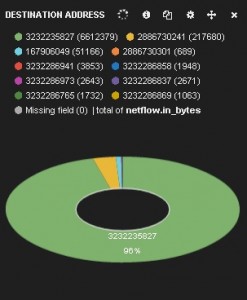 Destination address piechart panel
 Destination port piechart panel
We can see that the destination addresses are shown as numbers. That is because the Elasticsearch index template we created earlier treats the NetFlow source and destination address fields astype: "ip"and thus converts them to a sortable number. Queries and filters can still use the addresses, as we will see below. Administrators could, of course, choose to treat the addresses as strings, but that would affect sortability and querying and filtering performance.
Now we can create a top protocols table and traffic-over-time chart. First we create atablepanel with theInspect checkboxchecked, withTerm Mode: terms_ stats, Stats type: total, Field: netflow.protocol and Value Field: netflow.in_bytes. The Style istable. Then we create ahistogrampanel with theInspect checkboxchecked, withChart Value: total, Value Field: netflow.in_bytes and the Auto-interval checkboxchecked. The top protocols table and the traffic-over-time chart are shown below.
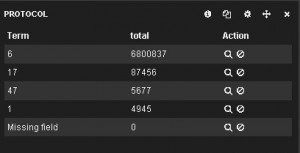 Protocols table panel
 Traffic panel
The whole dashboard can be found here. Of course, Kibana offers many more panels and features that can be added in a dashboard. The dashboard that contains all these panels can be saved and reused after being prompted to use the htpasswd created earlier. Then it can be accessed using h++p://10.0.1.33/index.html#/dashboard/elasticsearch/<dashboard_name>. The dashboard can also be exported and saved in the Kibana-3.1.1/app/dashboards/ directory as a json file and then copied into the /var/www/kibana3/app/dashboards/ directory. Afterward it can be accessed using h++p://10.0.1.33/index.html#/dashboard/file/<dashboard filename>.json.
For more information on rows, panels and dashboards, refer to the rows and panels and saving and loading documentation.
In conclusion, ELK is a set of very useful, open source analytics tools. We just saw how to set them up from scratch to consume NetFlow. Their capabilities are endless. It is up to the user to explore them...
Note:Readers should note that a prepackaged ELK stack can be downloaded in Vagrant. Someone using Vagrant would avoid taking all the steps to install and configure the ELK components, but would have less control and knowledge of how the ELK tools work together. For more information, refer to the Vagrant post.
 Tags chauds:
La sécurité
Données massives
netflow
big data analytics
Tags chauds:
La sécurité
Données massives
netflow
big data analytics
Inscrivez-vous par courriel maintenant pour le Stock de Promotion hebdomadaire
100% free, Unsubscribe any time!
Add 1: Room 605 6/F FA YUEN Commercial Building, 75-77 FA YUEN Street, Mongkok KL, HongKong Add 2: Room 405, Building E, MeiDu Building, Gong Shu District, Hangzhou City, Zhejiang Province, China
Whatsapp/Tel: +8618057156223 Tél. : + 33 (0) 3 88 88 20: 0086 571 86729517 Tel à HK: 00852 66181601
Courriel:: info@hi-network.com
 English
 Pусский
 Français
 Español
 Português
 Fast Shipping To HONGKONG