








This|blog|is authored by Jeremy Cohoe and Kareem Iskander
As Cisco platforms (IOS XE, IOS XR, NX-OS) continue to support IETF, OpenConfig, and Cisco Native YANG models, we needed to develop a tool to help make the lives of network automation engineers easier!
Cisco YANG Suite provides a set of tools and plugins to learn, test, and adopt YANG programmable interfaces such as NETCONF, RESTCONF, gNMI and more.
Imagine trying to leverage a new API endpoint to build your application without using some sort of testing tool to understand the endpoint and what it returns. That's not ideal or efficient.
This is what YANG Suite enables you to do when it comes to network programmability.
YANG Suite is built on a flexible architecture that is modular and plugin-based. The base plugins include the YANG file manager, the devices manager, a plugin for comparing YANG datasets and running diff's, support for NECONF, and for receiving gRPC Model Driven Telemetry. YANG Suite is available directly from the online Python Package Index which means that each of these plugins as well as the YANG Suite core itself can easily be upgraded once installed and running -updates are built in to the tool and are accessible by navigating to "Manage Plugins > Update"
YANG Suite's NETCONF plugin is one of the most used features of YANG Suite. The NETCONF plugins enables interacting with the network device over the NETCONF-YANG interface, building XML payloads based off of the YANG model, preforming the RFC standard get, get-config, edit-config, and action RPC operations, as well as supports working with the candidate datastore.
Alright let's get you all set up. Git is required to clone the Github repository, and both the Docker engine and Docker-compose are also needed. What we are about to do is clone the docker file from GitHub, navigate to the Docker image folder and bring up the container with YANG Suite running. Docker is used to create 3 containers: one for YANG Suite, one for the Nginx webservice, and one to store the YANG and runtime files in.
git clone https://github.com/CiscoDevNet/yangsuite
cd yangsuite/docker/ ; ./gen_test_certs.sh
docker-compose up
Yang Suite is now running on your localhost here -http://127.0.0.1
Now that YANG Suite has been installed and is accessible on your system, the day 0 workflow is as follows:
The YANG Suite Learning Lab has a detailed walkthrough for completing the Day 0 workflow within YANG Suite. In the example below the DevNet Always-On IOS XE Sandbox CSR1000 is added to the device profiles and used to download YANG models.

Once the device is added then the YANG modules can be downloaded and are available for interacting with from the specified "YANG Set" that is created. Multiple YANG Sets and Repositories are supported, so when you have a combination of YANG models from IOS XE, IOS XR, and NX-OS then it becomes easier to sort, group, and compare, and filter the YANG as needed. YANG Suite is ready once YANG files are loaded, so the next step might be to start sending some payloads to network devices.

The NETCONF plugin is used to build the XML payloads and send them to the device -the returned response is seen instantly. In this example the Cisco-IOS-XE-interfaces-oper.YANG module is used to collect the interface statistics for the GigabitEthernet1 interface on the Always On CSR1000:

Once the "Run RPC" button is selected then a new window pops up with the results. Examining the data shows some basic interface statistics and counters have been returned, this is a very common use case to understand the traffic on the ethernet interface of this device. The packets and bytes in and out of the interface are reported, as well as some other counters.
<?xml version="1.0" ?><rpc-reply message-id="" xmlns="urn:ietf:params:xml:ns:netconf:base:1.0"> <data> <interfaces xmlns="http://cisco.com/ns/yang/Cisco-IOS-XE-interfaces-oper"> <interface> <name>GigabitEthernet1</name> <statistics> <in-octets>10053738</in-octets> <in-unicast-pkts>89839</in-unicast-pkts> <out-octets>48755317</out-octets> <out-unicast-pkts>109243</out-unicast-pkts> <out-discards>858</out-discards> <rx-pps>2</rx-pps> <rx-kbps>2</rx-kbps> <tx-pps>5</tx-pps> <tx-kbps>153</tx-kbps> <out-octets-64>48755317</out-octets-64> </statistics> </interface> </interfaces> </data></rpc-reply>
Performing a NETCONF GET operation to understand feature state is one common use case with the YANG interfaces. But moving beyond one-time or static collection to a more dynamic and model driven telemetry collection is often desirable. The NETCONF RFC8641 has draft support for the yang-push mechanism for streaming telemetry, and YANG Suite helps to both enable tha telemetry as well as receive and collect it. Let's build the XML payload then send it to the device, then review the telemetry data stream as it comes into the new window within YANG Suite!
Building the NETCONF payload to enable telemetry is possible by using the IETF-event-notifications.YANG and requires 4 parameters to be entered to enable the telemetry configuration:
We can build this XML payload within YANG Suite:

Once the "Run RPC" button is selected a new window appears and the streaming telemetry is displayed, being updated every 10 seconds.

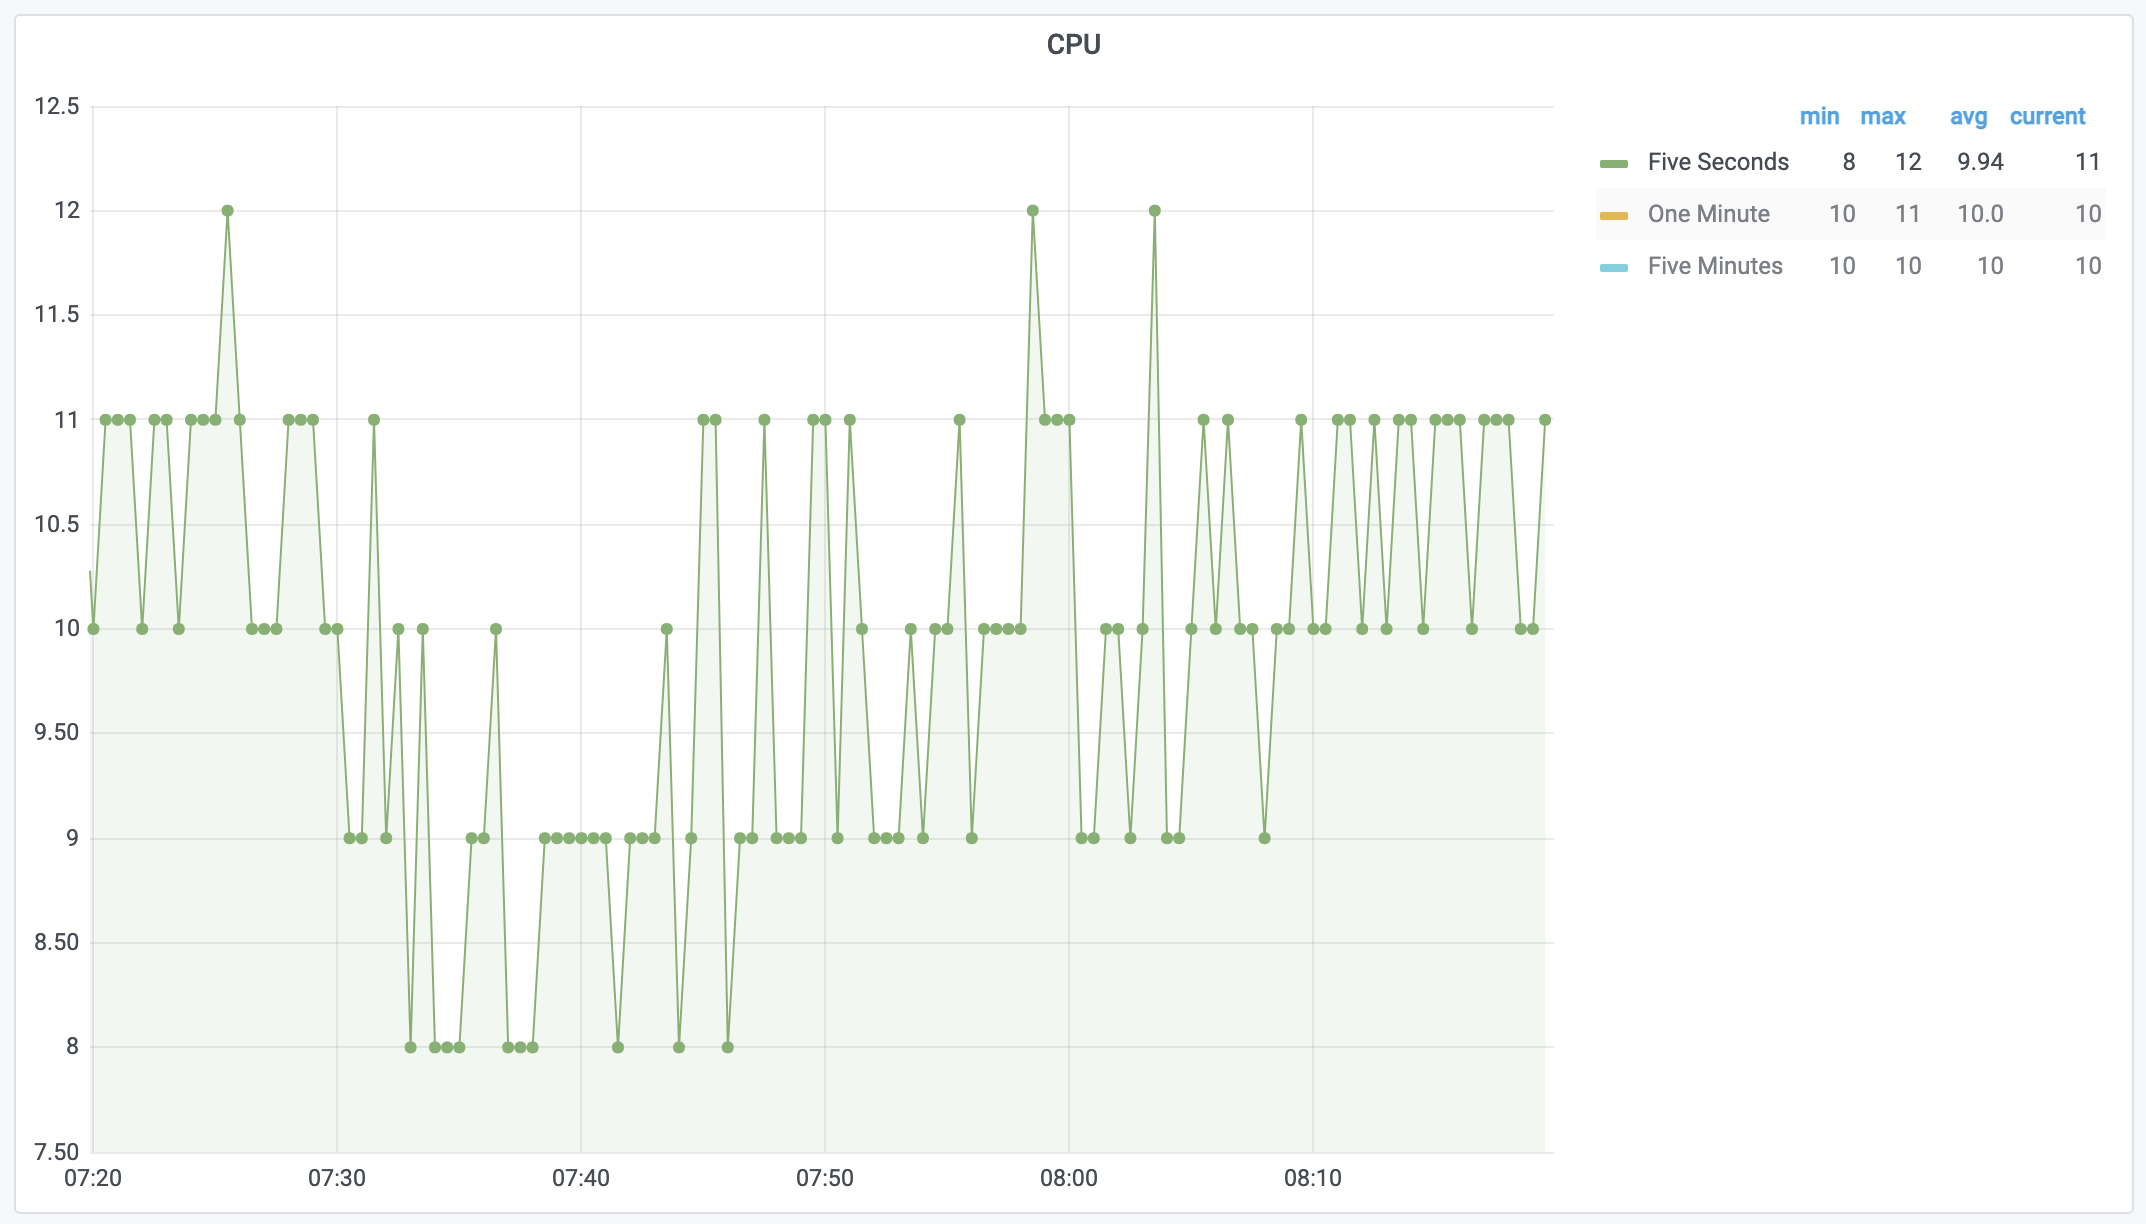
The CPU utilization is at 0% at both collection intervals. Putting this data into a Time Series Database such as InfluxDB or into another data visualization tool like Splunk or Elasticsearch is when the real power of network telemetry data can be observed. In the example below the CPU data is displayed within Grafana, part of the Telegraf and InfluxDB stack described in more details in this blog.
As you can see, YANG Suite has a lot of features and potential. From working with a variety of network devices, to managing sets of YANG files, exploring and comparing YANG files, interacting with NETCONF, collecting model driven telemetry, as well as a variety of other use cases. This is tooling to help network engineers and network automation spend less time on network operations so that more innovation and business value can be delivered.
We'd love to hear what you think. Ask a question or leave a comment below.
And stay connected with Cisco DevNet on social!
Twitter @CiscoDevNet | Facebook | LinkedIn
Visit the new Developer Video Channel
 Tags chauds:
Cisco DevNet
YANG
NETCONF/YANG
RestConf