Inscrivez-vous maintenant pour un meilleur devis personnalisé!


Ever hit anAPI rate limitunexpectedly? Or struggled to track which integrations are consuming the most API calls? We know that feeling-API troubleshootingcan be frustrating when there's little visibility into what's happening behind the scenes. Without clear insights, it's easy to run intoperformance issues, unexpected failures, and rate limit hits that slow down automation and network management.
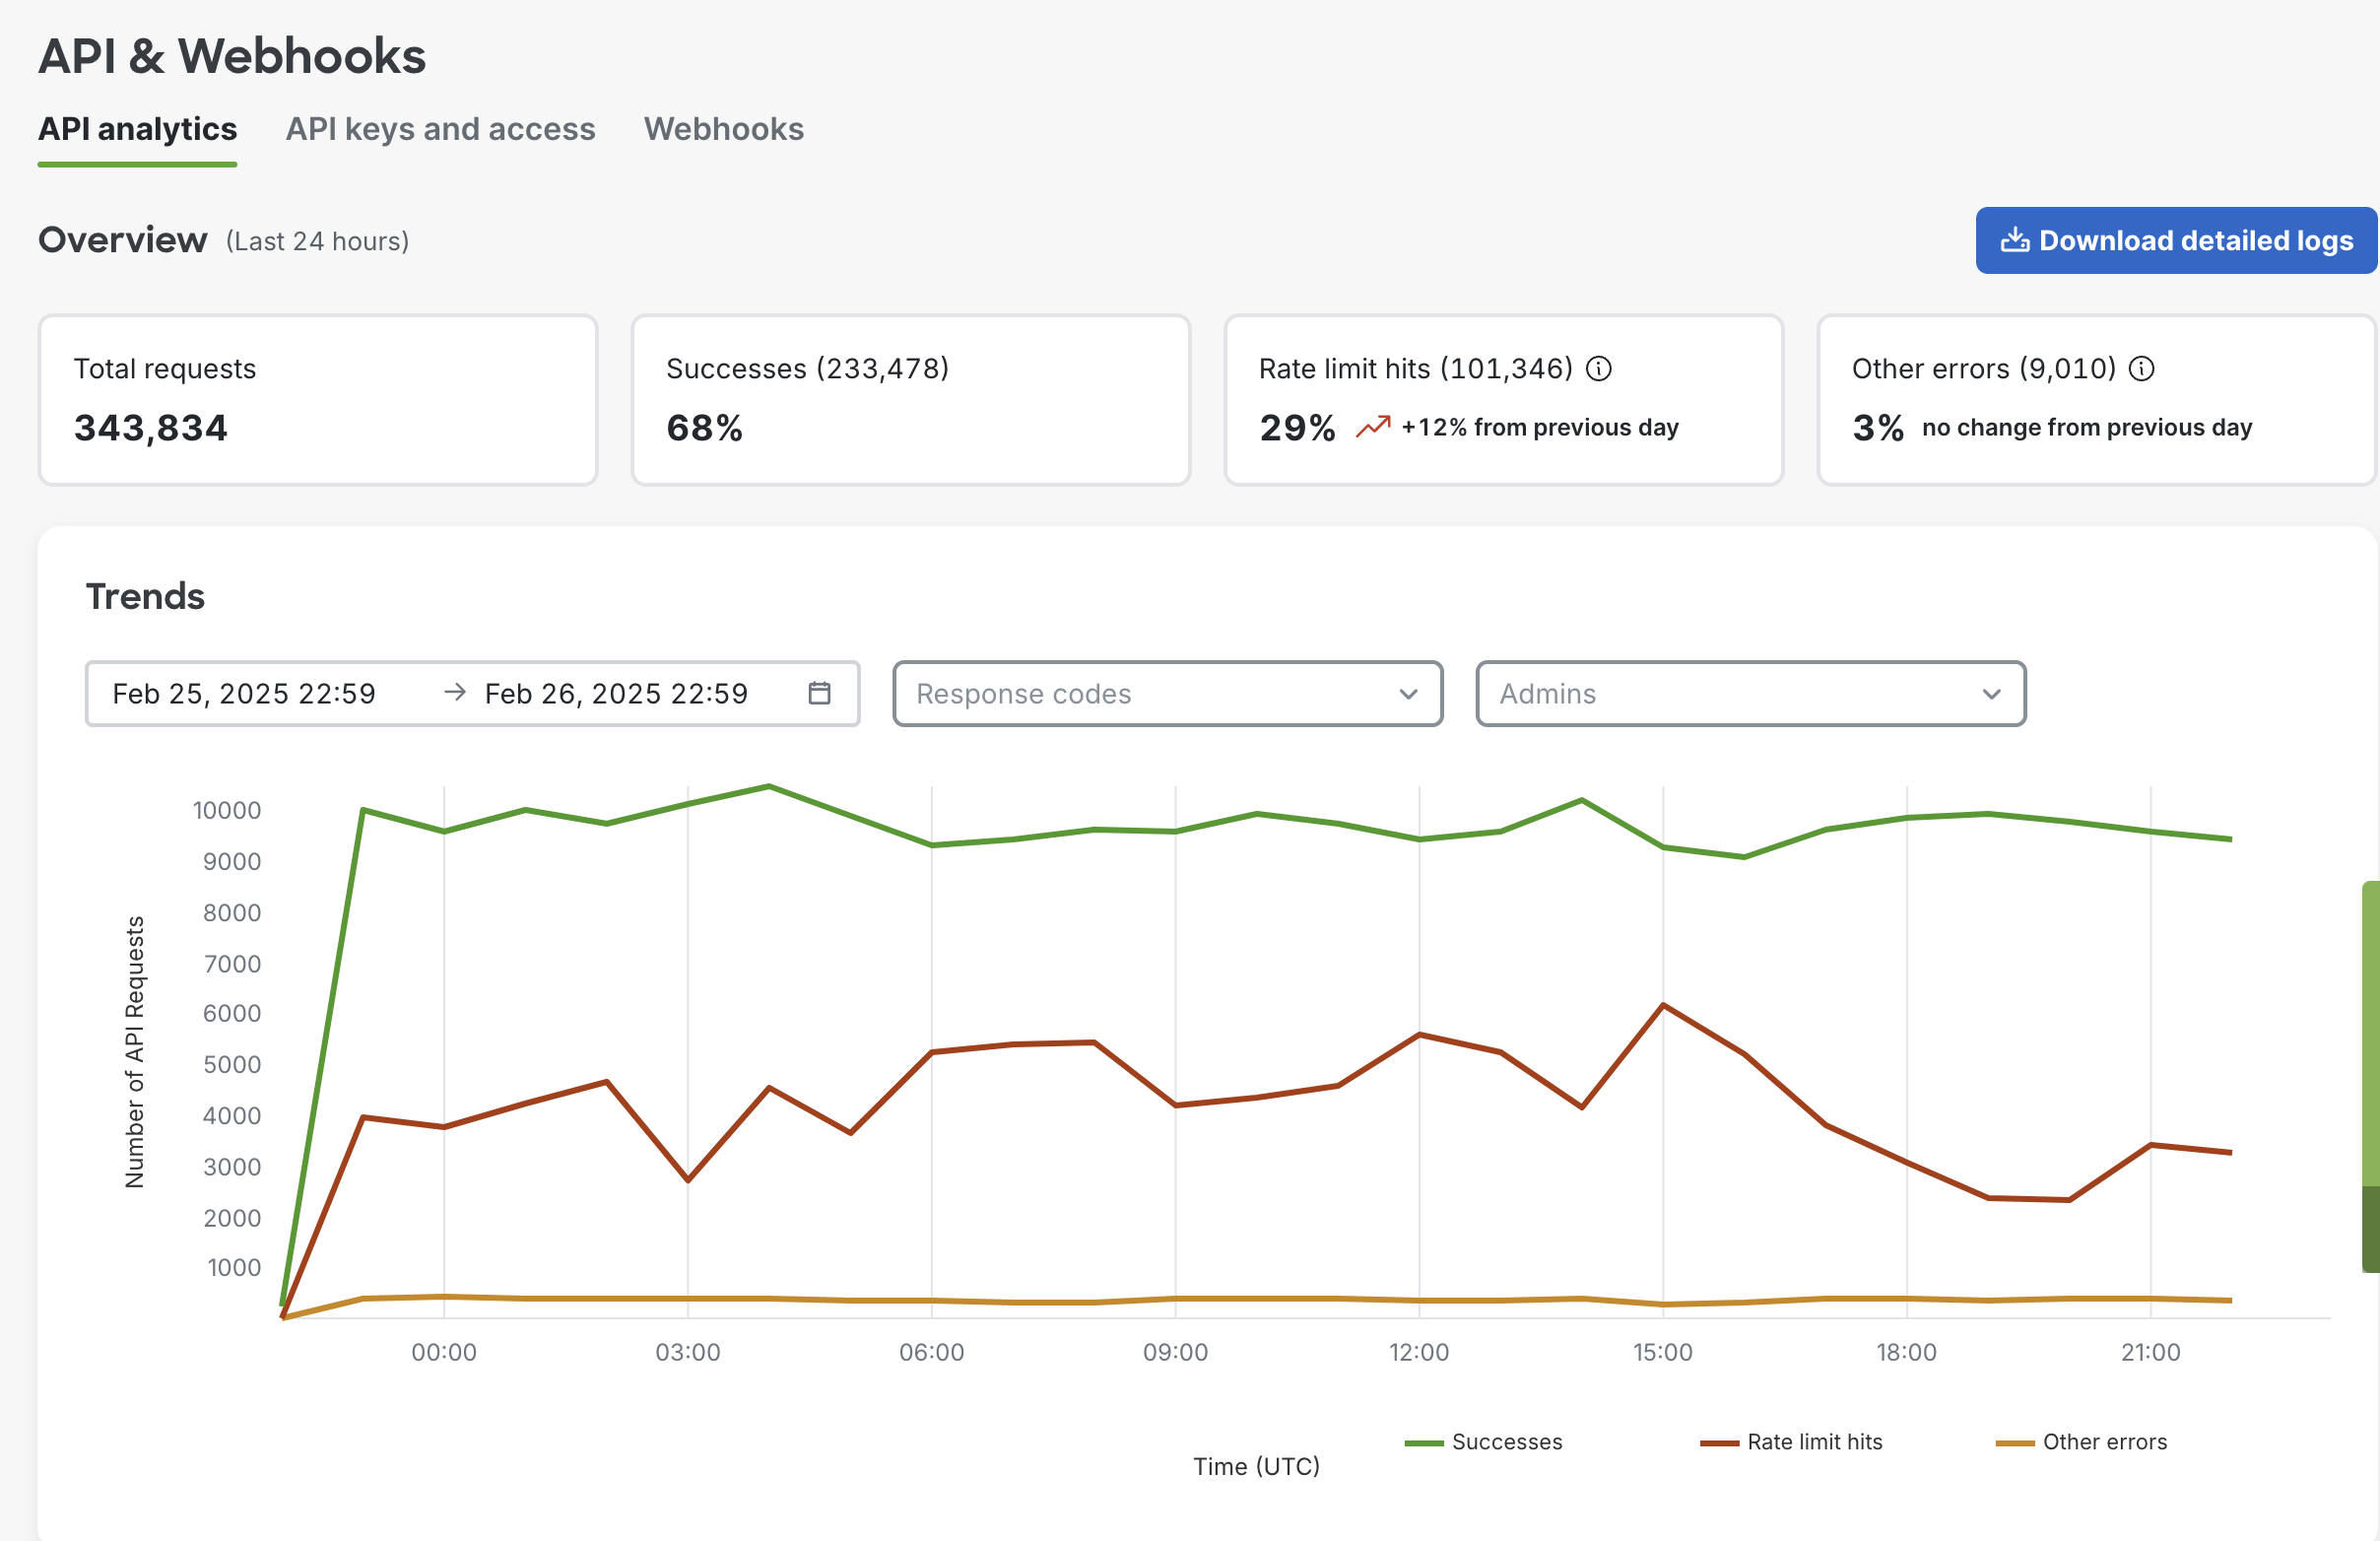
That's why we are excited to introduce theMeraki API Analytics Dashboard-a new API visualization tool designed to give better control and visibility into your API usage. Whether you're fine-tuning an integration, monitoring API calls, or managing API rate limits, this dashboard brings powerful insights to help you work smarter. Let's dive into what this means for you.
APIs are the foundation of automation in modern networking, but without proper monitoring, they can feel like a black box. Here are some common challenges we've seen developers and IT teams face:
With the newAPI Analytics dashboard, you finally have the data-driven insights needed to answer these questions-without manually digging through logs.
The API Analytics dashboard is designed to simplify API rate limit management, troubleshooting, and performance tracking. Here's what I love about it:
At a glance, you can seekey API usage metrics-total requests, success, errors, and rate limit status-all in one place. No more guessing!
A clean, intuitive graph helps you track API consumption over time. This makes it easier to spot spikes in usage, identify patterns, and optimize integrations before they become a problem.
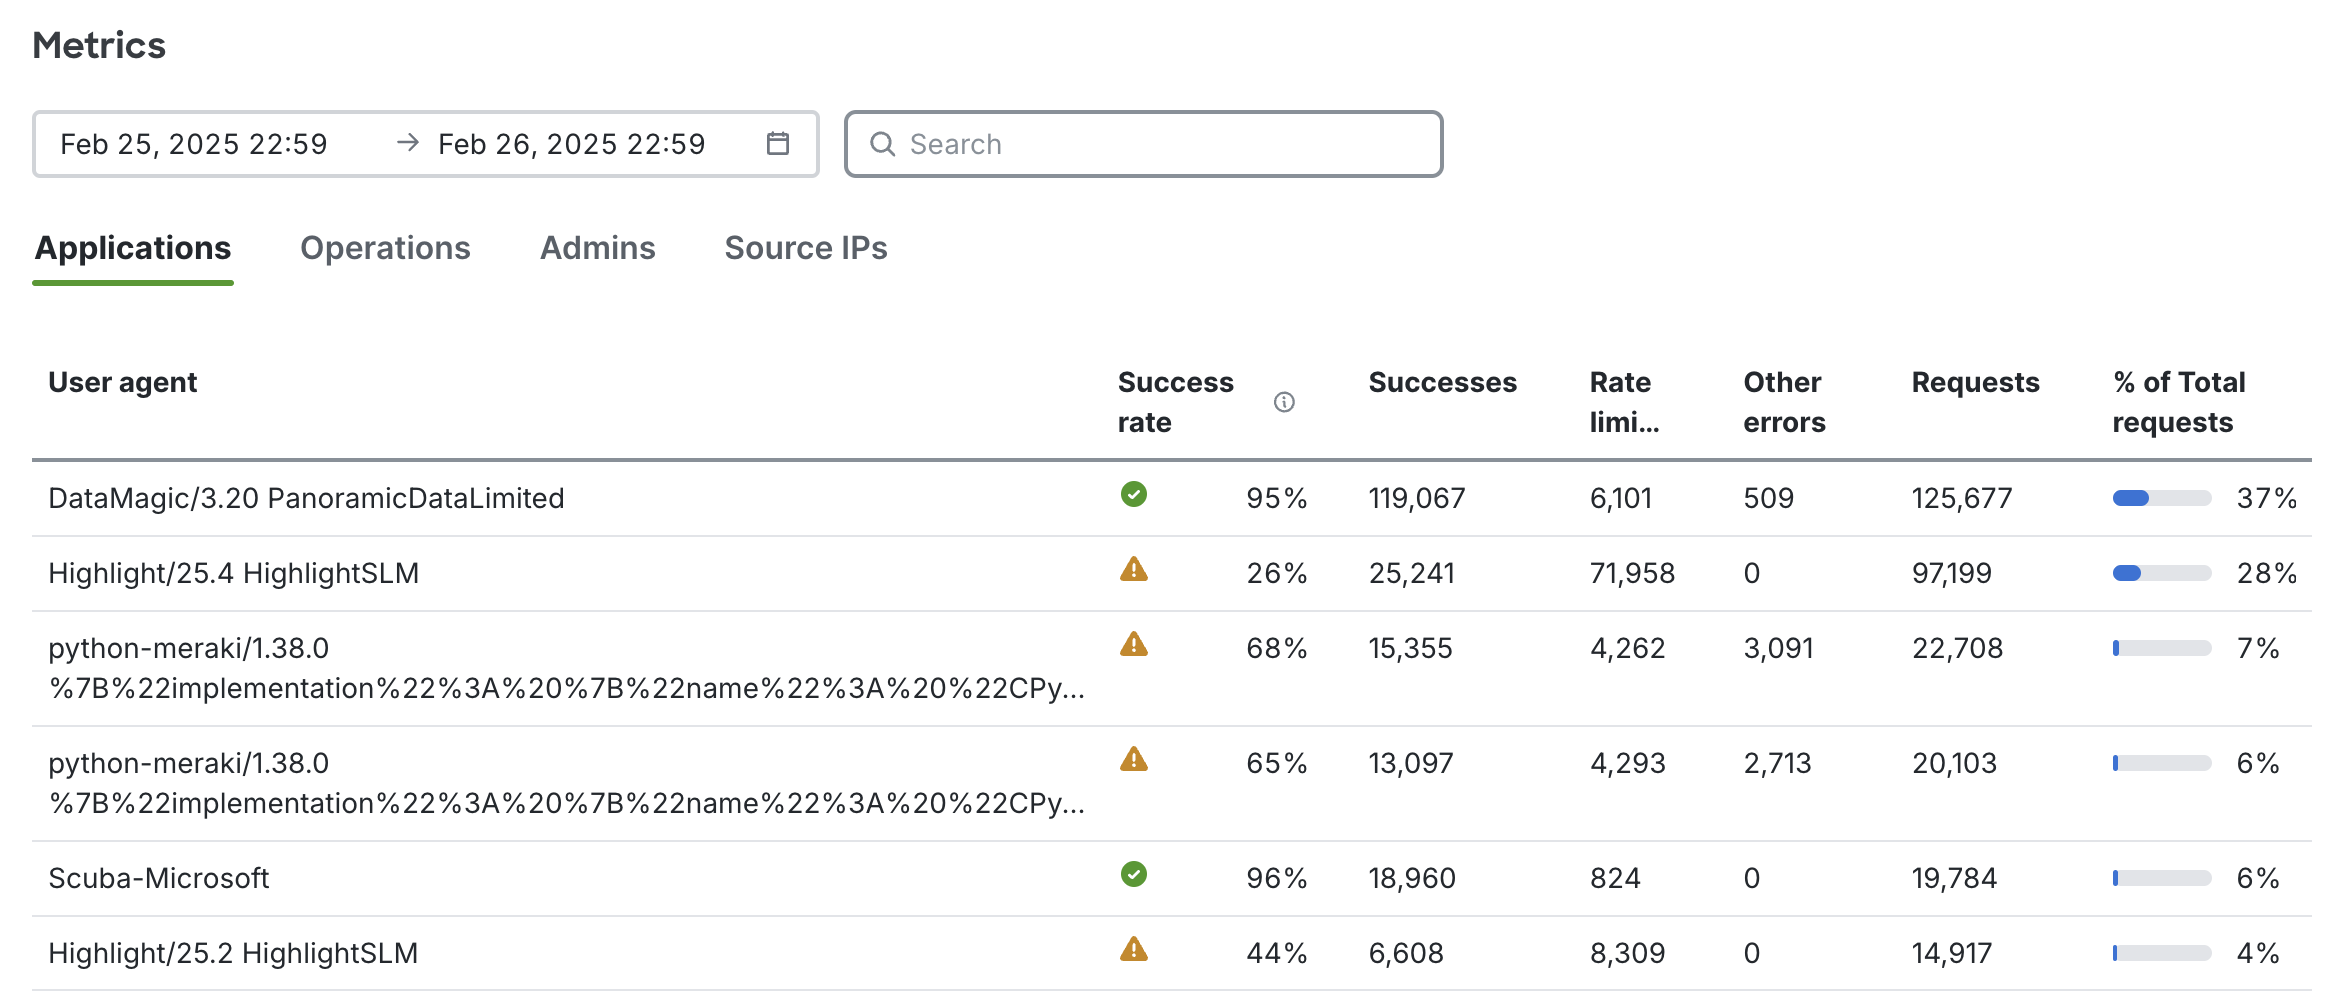
Now, you can see exactly which API endpoints are driving the most traffic. The Metrics section provides detailed insights across several key dimensions:
Each tab summarizes Total API requestsand their relative share of usage,Success vs. error ratesfor performance tracking andSuccess rate status iconsthat highlight areas needing attention.This is invaluable for troubleshooting performance issues and optimizing API call efficiency.
Need deeper analysis? You canexport detailed request logsin CSV format, making it easy to share insights with your team or dig into the data further.
You can find it in yourMeraki Dashboardunder:
Organization > API & Webhooks
This feature is now available, and I highly recommend checking it out to take control of your API consumption. For more tips on API rate limit management, check out our detailed guide onoptimizing API calls for your organization.
Got questions or feedback? Drop a comment below orengage with our community! We would love to hear about how the dashboard is helping you optimize your workflows.
 Tags chauds:
automation
Cisco DevNet
Cisco Meraki APIs
Tags chauds:
automation
Cisco DevNet
Cisco Meraki APIs
Inscrivez-vous par courriel maintenant pour le Stock de Promotion hebdomadaire
100% free, Unsubscribe any time!
Add 1: Room 605 6/F FA YUEN Commercial Building, 75-77 FA YUEN Street, Mongkok KL, HongKong Add 2: Room 405, Building E, MeiDu Building, Gong Shu District, Hangzhou City, Zhejiang Province, China
Whatsapp/Tel: +8618057156223 Tél. : + 33 (0) 3 88 88 20: 0086 571 86729517 Tel à HK: 00852 66181601
Courriel:: [email protected]
 English
 Pусский
 Français
 Español
 Português